Integrating Financial Analysis and Algorithmic Trading in Python
The convergence of finance and technology has given rise to algorithmic trading, where sophisticated scripts leverage data science techniques to make informed investment decisions. This essay explores a Python script that seamlessly integrates financial analysis and algorithmic trading, utilizing candlestick patterns for market insight and executing trades based on predefined strategies.
Candlestick Pattern Analysis
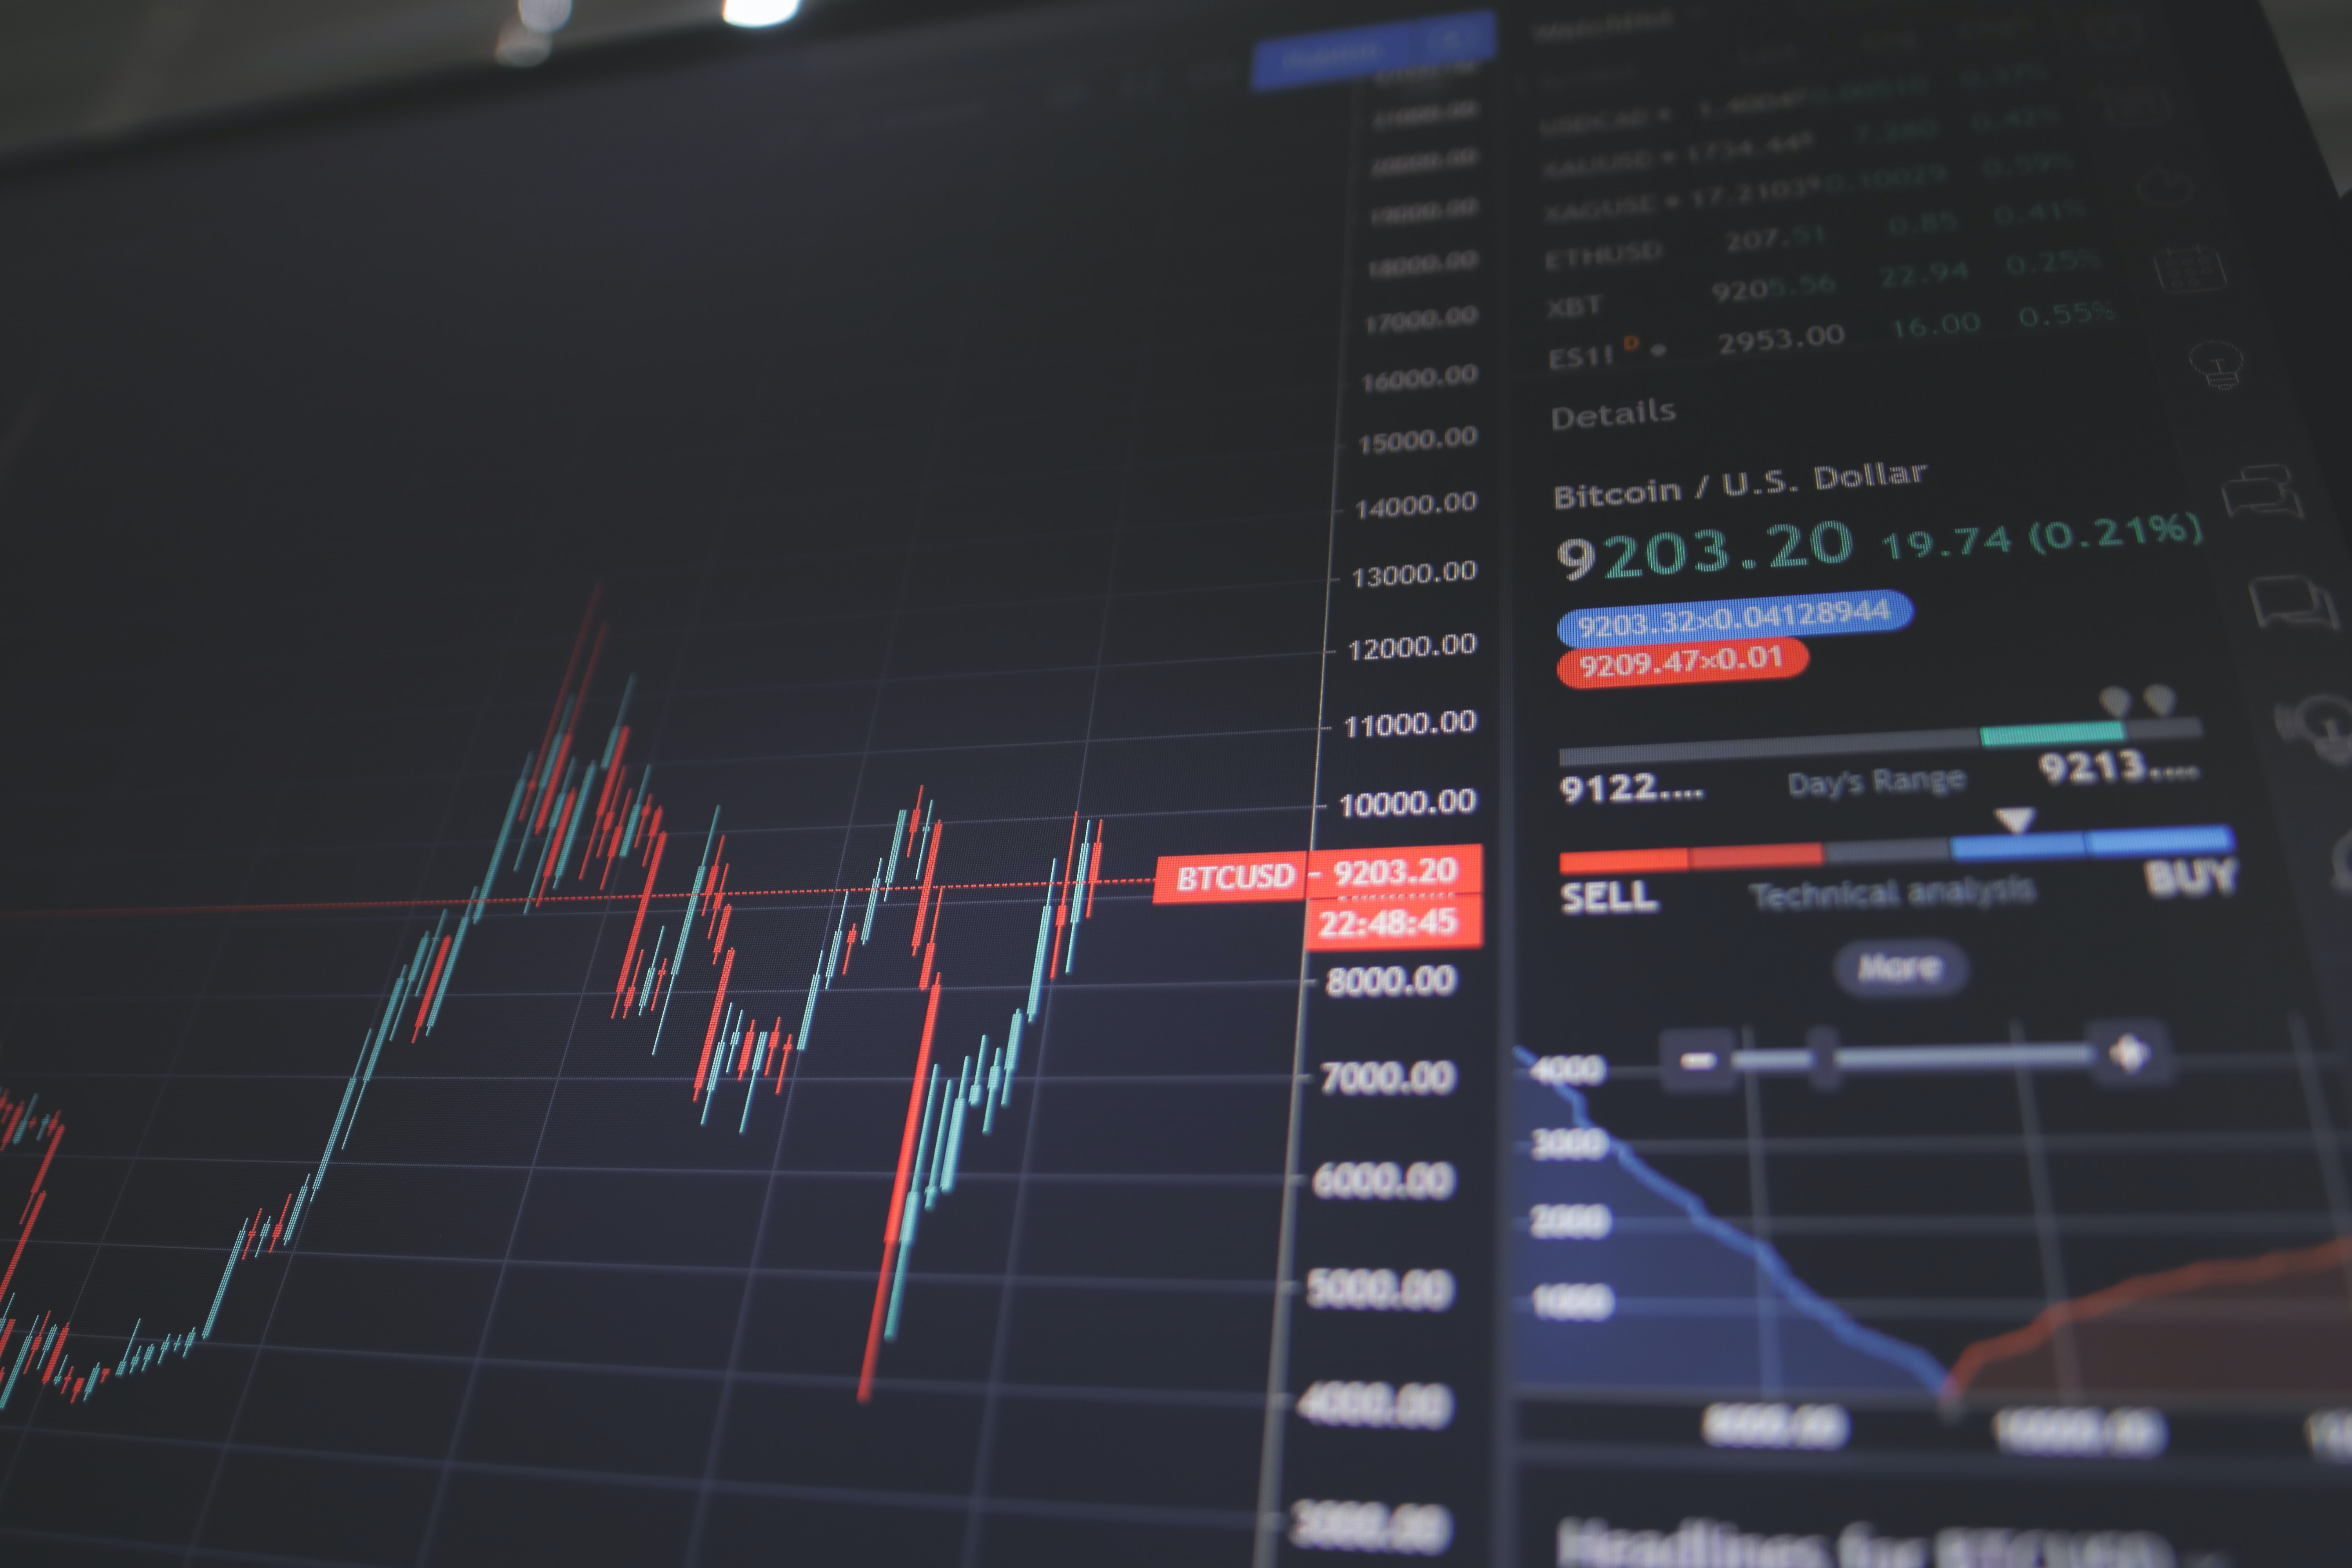
The script begins by loading historical market data in the form of candlestick patterns from a CSV file, using the mplfinance library for visualization. Candlestick patterns, representing price movements, are meticulously identified, ranging from bullish signals like 'inverted hammer' to bearish indicators like 'dark cloud cover.' This analysis forms the foundation for the subsequent trading strategies.
Technical Analysis and Pattern Detection
The script employs a modular approach, encapsulating candlestick patterns in a separate module, enabling extensibility and code organization. For each predefined pattern, the script detects occurrences in the historical data and prints the corresponding timestamps. This transparent approach allows users to inspect and validate the accuracy of pattern recognition.
Bullish and Bearish Categorization
Patterns are categorized into bullish and bearish groups, providing a nuanced understanding of market sentiment. This categorization becomes instrumental in formulating trading strategies that capitalize on upward trends or protect against potential downturns.
Algorithmic Trading Strategies
The script integrates with Alpaca, a trading API, to execute algorithmic trading strategies based on the identified candlestick patterns. It dynamically manages portfolios by buying and selling assets, considering stop-loss and take-profit thresholds. The inclusion of risk management strategies enhances the robustness of the trading algorithm.
Real-Time Market Monitoring
To adapt to changing market conditions, the script incorporates real-time market monitoring. It updates candlestick patterns and asset prices, ensuring that trading decisions align with the latest market developments. This responsiveness is critical in the dynamic landscape of financial markets.
Simulation and Performance Metrics
The script provides a simulated environment for testing trading strategies. It calculates performance metrics, offering insights into historical effectiveness. Visualization tools illustrate portfolio and savings history, aiding in the interpretation of algorithmic trading outcomes.
Conclusion
In conclusion, the Python script showcased in this essay exemplifies the fusion of financial analysis and algorithmic trading. By leveraging candlestick patterns and integrating with Alpaca for execution, the script offers a comprehensive solution for both analyzing historical market data and implementing algorithmic trading strategies. The modular design, real-time monitoring, and performance metrics contribute to a versatile tool for traders and analysts navigating the complexities of financial markets. As the realms of finance and technology continue to intertwine, scripts like these underscore the importance of computational tools in making informed investment decisions.